Population Pyramids
The characteristics of a population, the distribution of age, sex, ethnicity, religion etc, is known as the population structure
It is the result of changes in:
fertility
mortality
migration
The two main components of age and sex can be shown on a population pyramid
Population pyramids
Population pyramids (also known as an age structure graph) are used to display the gender and age structure of a given population
They illustrate the distribution of the population across age groups and between male/female
They enable governments nationally and regionally to assess the needs of the population for services such as healthcare and education
This means the governments can estimate and plan for spending
As countries develop and pass through the stages of demographic transition the shape of the population pyramid changes
The population pyramid can be used to identify the following groups:
Young dependents
Old dependents
Economically active (working population)
Dependency ratio
Population Pyramid - Niger
LEDCs like Niger have a concave pyramid shape
At the start of stage 2 of the demographic transition model
This indicates:
High birth rate
Low life expectancy
High death rate but starting to decrease
High infant mortality rate
Young dependent population dominates
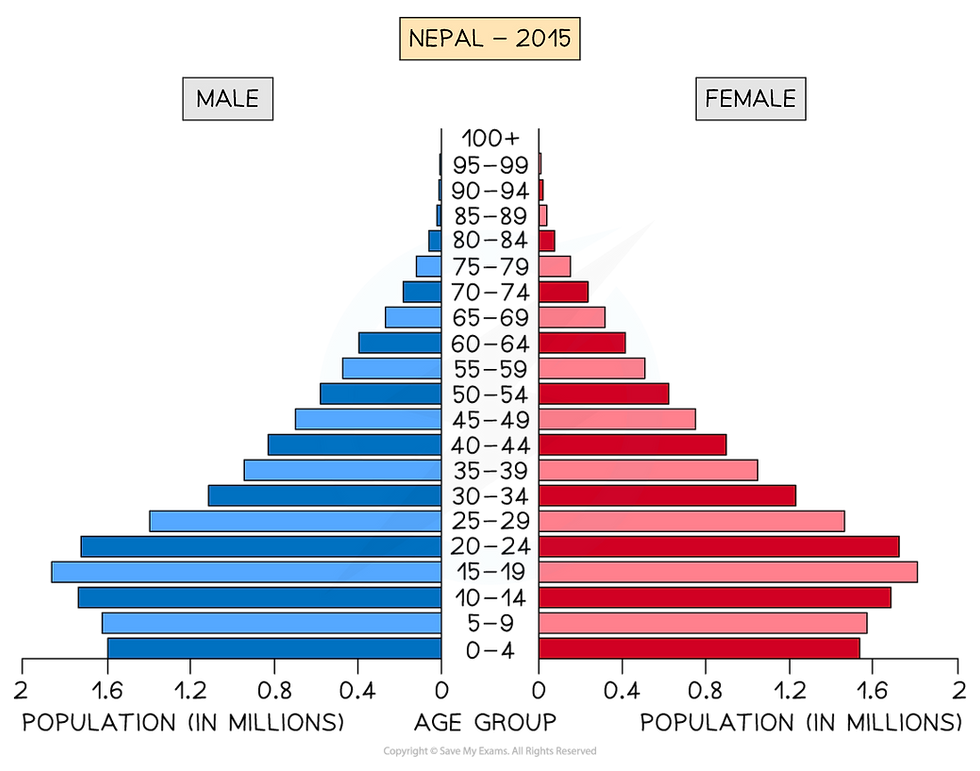
Population Pyramid - Nepal
LEDCs/NICs that are a little further along the demographic transition such as Nepal has a convex pyramid shape
Stage 3 of the demographic transition model
This indicates:
Decreasing birth rate
Increasing life expectancy
Decreasing death rate
Decreasing infant mortality
Larger working age population
Population Pyramid - USA
HIC countries such as the USA have a column shape
Stage 4 of the demographic transition model
This indicates:
Decreasing birth rate
Increasing life expectancy
Decreasing death rate
Low infant mortality
Larger working age population
Population Pyramid - Japan
HIC countries such as Japan have a pentagon shape with a narrowing base
Stage 5 of the demographic transition model
This indicates:
Decreasing birth rate
Increasing life expectancy
Death rate is higher than the birth rate due to the ageing population
Low infant mortality
Ageing population - older dependent population
Implications of population structure
Population pyramids mean that population issues can be identified
There are a range of issues including:
Ageing populations
Falling birth rates
Impacts of migration
Ageing populations
Many HICs are experiencing ageing populations and an increase in the older dependent population, the implications of this include increased:
Pension payments
Need for care homes
Pressure on the healthcare service and social care
It also results in fewer workers which means:
Governments are not able to collect as much tax
Some areas suffer worker shortages
Falling birth rates
Countries experiencing falling birth rates include many HICs and MICs, the implications of this include:
School closures due to fewer children
Future workforce shortages
Migration
In some countries, migration can lead to an imbalance in the population structure
The UAE has significantly more males than females
29% of the population are males between the ages of 25 and 39 whereas only 10.5% of the population are women 25-39
This is the result of the migration of males to the UAE to work in the oil, gas and construction industries
Rapid population growth in some areas as a result of migration can lead to:
Increased pressure on services such as healthcare and schools
A shortage of housing
Increased traffic congestion
Increased water and air pollution
Shortage of food
Lack of clean water
Exam Tip
When interpreting a population pyramid you need to look at four key areas
Young dependents - is the birth rate high or low?
Working population - are there enough people of working age to support the young and old dependents?
Old dependents - is it large or small? If it is large, then life expectancy is high
Male/female split - are there any noticeable differences between the numbers of males and females?


